AI calorie photo accuracy is weaker than a weighed plate. The app guesses the food, then the portion, then the energy. Those guesses stack. This is a source-reviewed guide, not a hands-on lab test.
A photo log feels objective. The camera is honest. The model is not. AI calorie photo accuracy depends on lighting, camera angle, what is hidden under sauce, and which row the app picks from its table.
This page sits beside the best meal planning apps hub. Those reviews cover features. Here the question is measurement. For how two photo tools present numbers, see the Foodvisor review and the Cal AI review. We do not crown a “most accurate camera” winner. Models change. Study plates are not your dinner.
We do not promise weight change from a green ring. Energy balance is bigger than one snap. If you use a calorie target for a clinical diet, ask the clinician who set it. An app is not that clinician.
How a photo becomes a calorie number
Most consumer tools run three steps. First they name the items. Then they guess volume or weight. Then they look up energy in a nutrient table. A miss at any step moves the total.
Shonkoff’s team searched the literature through May 2023. Seventy-nine percent of retained papers used a convolutional neural network for detection. Ground truth was usually a nutrient table (51%) or weighed food (27%). Meta-analysis was not possible. Image sets and reported metrics differed too much.
Cofre and colleagues (British Journal of Nutrition, 2025) reviewed 13 AI dietary-assessment studies to 1 December 2024. Six papers reported a correlation above 0.7 for calories versus a traditional method. The same count held for macronutrients. Eight of 13 papers had moderate risk of bias. Most work sat in preclinical settings, not in a supermarket queue.
A research model trained on one cuisine is not your phone’s current app. Treat published ranges as a floor, not a store ranking.
What AI calorie photo accuracy studies measured
Consumer apps are harder to test than lab models. The store build changes. The database is partly user-written. A few teams still put named apps against a reference meal.
Joubert’s group (2021) used hospital lunches. Medical students acted as mock patients. Foodvisor’s photo tool underestimated whole-meal carbohydrate by 7.2 ± 17.3 g versus a reference count. Thirty percent of meals had an absolute error above 20 g. Glucicheck, a manual photo-gallery tool, sat closer (1.4 ± 13.4 g). Both apps still beat the large everyday errors often reported in type 1 diabetes carb counting. That is a clinical adjunct finding, not a calorie warranty.
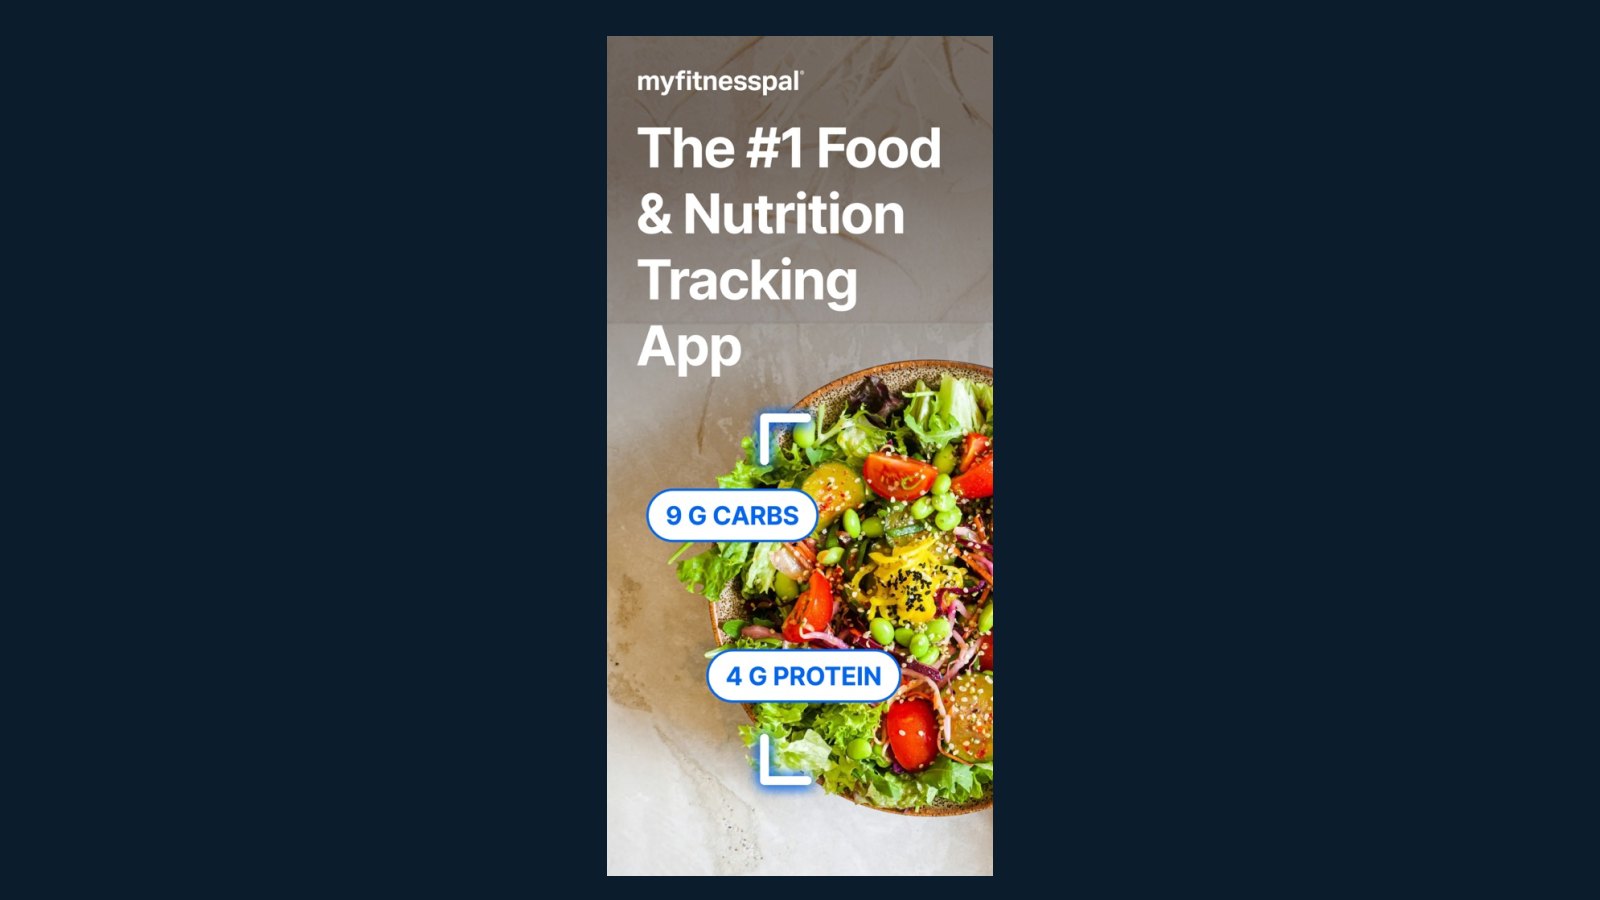
Chen and colleagues at the University of Sydney (Nutrients, 2024) screened 800 store listings and tested 18 apps. Seven had AI image recognition. On a small plate set, MyFitnessPal recognised 97% of food components and Fastic 92%. Lose It! and FatSecret each recognised 46%. Automatic energy was worse. Foodvisor (version 5.15.0-1) sat 47% below the food-record energy. MyFitnessPal (24.10.0) sat 3% below. HealthifyMe sat 8% above. Fastic sat 44% above. Mixed dishes and culturally diverse foods were the weak zone.
Kayashita and colleagues (Nutrients, 2026) photographed 15 standardised hospital meals under fixed light and a 90-degree angle. Ground truth was direct weighing. Ten registered dietitians and ten AI models estimated energy and macros. Top models, including ChatGPT-4o and Gemini 1.5 Pro, tracked energy and carbohydrate reasonably (r > 0.8 in the authors’ screen). All tested AI models overestimated lipids, with mean bias above +20%. The authors called this an “invisible nutrient” bias. Cooking oil does not always show.
| Question or claim | Evidence source | Study type | Population | Reference standard | Outcome | Key finding | Limitation | Applicability |
|---|---|---|---|---|---|---|---|---|
| How large are image-AI calorie errors? | Shonkoff 2023, Annals of Medicine | Systematic review | 52 papers, 2010–2023 | Nutrient tables or weighed food | Calories and volume | Relative calorie error 0.10% to 38.3%; simpler plates did better | No meta-analysis; mixed databases | Research models, not one 2026 store app |
| Do AI methods match traditional logs? | Cofre 2025, British Journal of Nutrition | Systematic review | 13 studies to Dec 2024 | Traditional dietary assessment | Correlation | Six papers r > 0.7 for calories; 61.5% preclinical | Moderate bias in 8 of 13 | Not a consumer ranking |
| Can Foodvisor count meal carbohydrate? | Joubert 2021, Diabetes Therapy | Prospective app test | Hospital lunches; mock patients | Reference carb count | Carbohydrate grams | Mean error −7.2 g; 30% of meals off by >20 g | One cuisine; older app build | Useful as an adjunct, not insulin maths alone |
| Do store photo tools match food-record energy? | Chen 2024, Nutrients | Comparative validity | Small Western, Asian and “recommended” plates | Food records | Recognition and energy | Foodvisor energy −47%; MyFitnessPal −3%; mixed dishes failed more | Few images; Australian store list | Shows the split between naming food and counting energy |
| Do large vision models miss cooking fat? | Kayashita 2026, Nutrients | Lab photo vs weigh-out | 15 hospital meals; 10 dietitians; 10 models | Direct weighing | Energy and macros | Energy/carbs closer; lipid mean bias > +20% for all AI models | Controlled light; Japanese hospital menu | Warns against trusting fat from a tidy photo |
Why fats and mixed plates fail
Energy density hides in pale liquids. Oil, cream and melted cheese raise kilocalories without adding much volume. Kayashita’s lipid bias is the same problem in a hospital tray. A home stir-fry with two spoons of oil will look like the version with one.
Portion error is the other stack. A bowl photographed from above can look larger than a bowl from the side. Shonkoff noted lower relative error when images held single, simple foods. A mixed plate is several guesses at once.
Database error then multiplies both. If the model names “chicken rice” and the table holds a greasy takeaway row, the number follows the row. If it holds a steamed canteen row, the number follows that instead. The photo did not choose the recipe. The table did.
Consumer apps versus lab models
Lab papers often test a single architecture on a curated image set. Store apps add a barcode path, a user-edited database and a weekly model update. Chen’s team said automatic energy from image recognition was inaccurate even when naming looked tidy.
We did not find a 2026 peer-reviewed calorie protocol for Cal AI. If a brand has not published a methods paper against weighed food, we omit a percentage. Marketing copy is not a validation study.
Foodvisor has been in more than one independent test. The 2021 carb study and the 2024 energy comparison do not agree on a single error. They used different meals and different builds. That spread is the story. AI calorie photo accuracy is protocol-dependent.
Barcode logging is a different tool. It reads a pack, not a plate. See how scores and labels behave in the Yuka review. A pack scan still inherits label error. It does not solve a cooked dinner.
How to use a photo log without treating it as a lab
Use the photo as a memory aid. Confirm the food name. Correct the portion. Weigh a few staple meals once if you need tighter numbers. Then reuse those saved items.
Watch protein and fibre in food language, not only in a badge. Our everyday protein intake guide keeps portions in beans, eggs and fish. A camera that misses oil will also miss how filling the plate was.
If you keep calories visible, compare weeks on the same app and the same camera angle. Do not subtract a restaurant snap from a clinical target and call the day closed. Diet trials that “eat back” wearable or app calories often over-eat because the model was high — or under-eat because it was low.
Hide the number if it runs your mood. Minutes of meals, hunger and a simple plate pattern still work when the tile is off.
What remains unverified
We cannot verify 2026 calorie error for every photo app in the store. We cannot convert your phone’s kilocalories into a weight-loss forecast. That would invent a clinical effect.
We also cannot say a newer large model is “solved” because it beat dietitians on 15 hospital trays. Those trays were lit, plated and weighed. Your kitchen is not.
Treat the energy tile as weather, not as a receipt. If the snap helps you notice a missed meal, keep it. If it becomes a verdict, put the phone down and keep the plate.
Frequently asked questions
Is AI calorie photo accuracy good enough to diet from?
Why does the same lunch change number when I retake the photo?
Are research models more accurate than store apps?
Does a correct food name mean the calories are right?
What should I watch instead of the calorie badge?
Did Vitality Ledger photograph meals and weigh them?
Sources
- 1. AI-based digital image dietary assessment methods compared to humans and ground truth: a systematic review
- 2. Validity and accuracy of artificial intelligence-based dietary intake assessment methods: a systematic review
- 3. Prospective independent evaluation of the carbohydrate counting accuracy of two smartphone applications
- 4. Evaluating the quality and comparative validity of manual food logging and artificial intelligence-enabled food image recognition in apps for nutrition care
- 5. Accuracy of AI-based nutrient estimation from standardized hospital meal images: a comparison with registered dietitians
- 6. The Eatwell Guide
Guidance changes. Figures were checked against the sources above at the time of review; always confirm current advice with your GP, pharmacist or clinician.
Image credits
- Photo: Photo by Shixart1985 on Wikimedia Commons / Openverse
- Photo: Photo by Jeremy Keith on Wikimedia Commons / Openverse
- Photo: Photo by Dmitry Bagrov on Wikimedia Commons / Openverse
- Photo: Photo by margenauer on Pixabay via Wikimedia Commons / Openverse
- Photo: Photo by Daniel Schwen on Wikimedia Commons / Openverse
Was this useful?
Anyone can react — no account needed.
Discussion
0 comments · Name and email only · Email is never shown