
Food scoring apps accuracy is not a lab grade. The number is a recipe of chosen nutrients, chosen penalties and a chosen scale. Two honest systems can rank the same yogurt differently. This is a source-reviewed guide, not a hands-on lab test.
A red or green badge at the aisle feels final. It is a compression. Food scoring apps accuracy depends on what the algorithm is allowed to see. Most see per-100 g nutrients. Many do not see how the food was made. Almost none see how much you will eat.
This page sits beside the best meal planning apps hub. Product pages such as the Yuka review and the Ivy review cover claimed features. Here the question is what one mark can hide. We do not invent a blended Vitality Ledger score.
Never treat a barcode grade as a diagnosis. If you manage diabetes, kidney disease or an eating disorder, follow the clinician who knows you. A shopper app is not that clinician.
What a food score is built from
Nutrient profiling turns a short list of numbers into a rank. The UK Food Standards Agency model that later fed Nutri-Score used energy, sugars, saturated fat and sodium as “less healthy” points. Protein, fibre and fruit, vegetable and nut content offset those points. The output is a class, not a meal plan.
Van Tongeren and Jansen (Foods, 2022) reviewed Nutri-Score’s validation trail. They found content-validity work that ranks the food supply, and convergent work against French dietary guidelines. They also said European applicability was still unsettled. Predictive validity — does the class forecast disease when applied to diets — needed re-checking after algorithm updates.
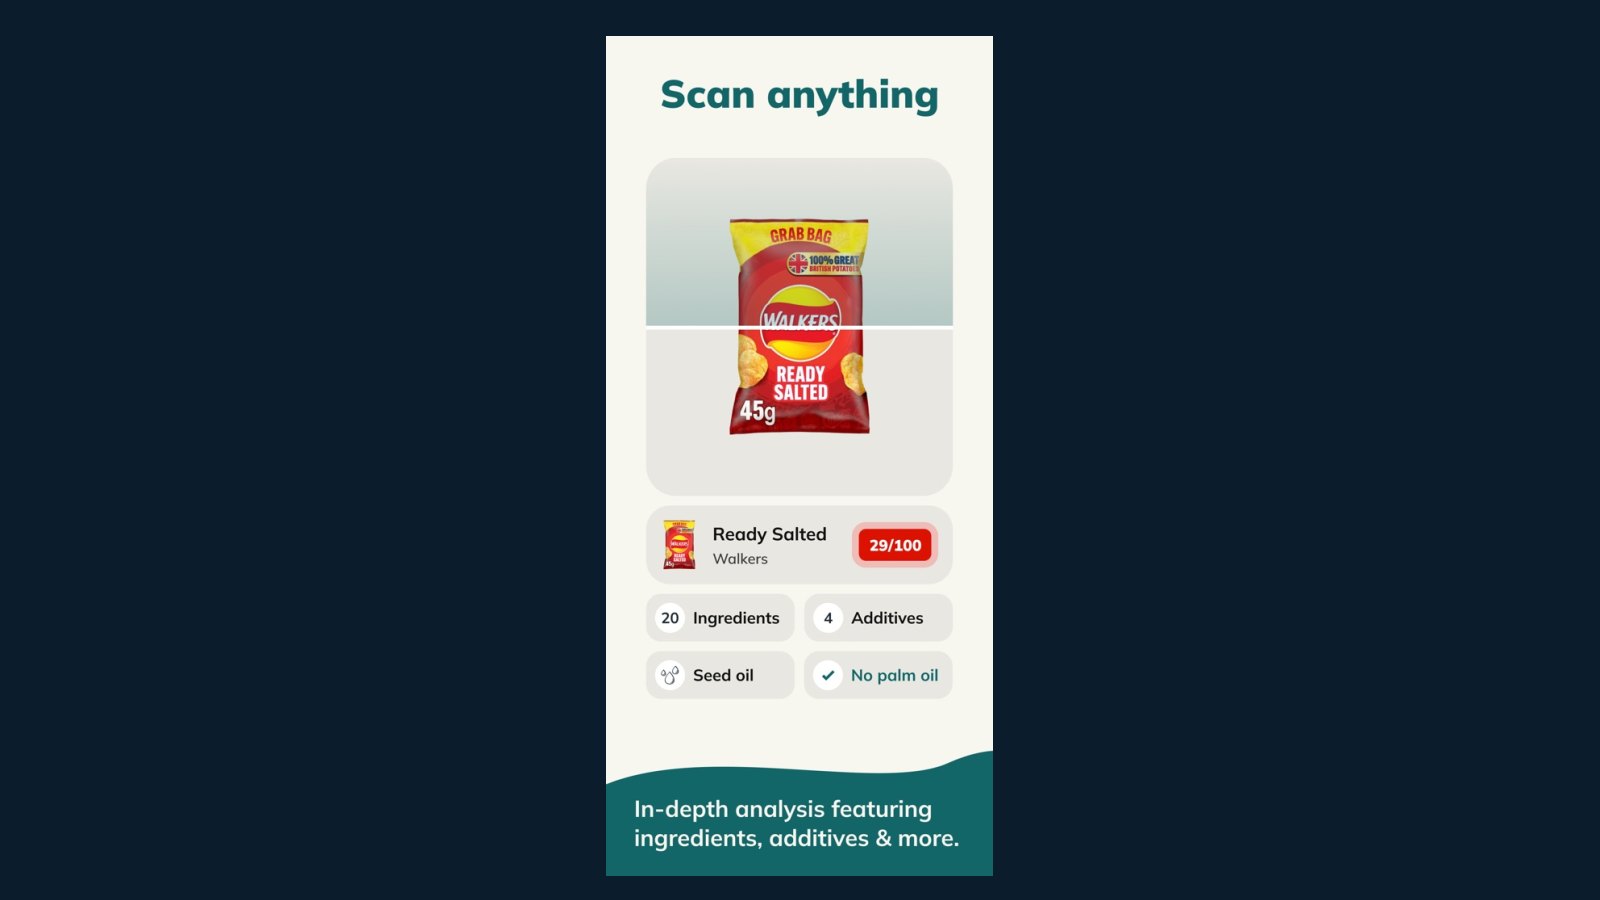
Yuka is not Nutri-Score. Its English help page says nutritional quality is 60% of the food mark and “based on Nutri-Score.” Additive presence is 30%. An official organic label is a 10% bonus. If Yuka classes an additive as high-risk, the maximum mark is 49/100. That cap can outweigh the nutrition slice. The additive colours are Yuka’s reading of EFSA, IARC and other papers. They are not an EFSA product licence.
Ivy, on its public site and terms (captured 13 September 2026), says it rates processing from manufacturer labels and Open Food Facts. It lists sugar, ingredients, seed oils, pesticides, microplastics and heavy metals among the metrics. The publisher says it does not laboratory-test the pack. Errors of composition can occur. That is a house score, not a NOVA audit paper.
What independent studies measured
Most peer-reviewed work tests Nutri-Score or other front-of-pack schemes, not every store app. That still matters. Many consumer scores borrow the same nutrient math.
Bossuyt and colleagues (Nutrients, 2021) ran an eye-tracking study with 398 people and 20 products. Nutri-Score improved healthfulness estimates, more so on “equivocal” packs that are hard to judge by eye. Adding the full Nutrition Facts panel did not help and sometimes hurt. The authors pointed to cognitive overload. A simple class can beat a dense table in a short glance. That is a perception finding, not a nutrient assay.
Romero Ferreiro, Lora Pablos and Gómez de la Cámara (Nutrients, 2021) cross-classified Spanish products by Nutri-Score and NOVA. About 75.5% of ultra-processed (NOVA 4) items sat in Nutri-Score C, D or E. Ultra-processed foods still appeared in every class. They made up about 26% of the A group in that set. The authors said the logo does not identify processing.
A 2020 Open Food Facts cut cited by the Nutri-Score team looked at 220,522 ultra-processed items. Eight percent ranked A and 13% ranked B. Seventy-nine percent sat in C, D or E. Later algorithm updates moved some drinks and breads. Sarda and colleagues (2024) reported that the update cut A and B ratings among ultra-processed foods more than among unprocessed foods. The two systems still measure different things.
We did not find a peer-reviewed study that audits Yuka’s 100-point mark against a clinical outcome. We also did not find a methods paper that validates Ivy’s house rating against expert NOVA coding. If the paper is missing, we omit a percentage.
| Question or claim | Evidence source | Study type | Population | Reference standard | Outcome | Key finding | Limitation | Applicability |
|---|---|---|---|---|---|---|---|---|
| Does a letter help people judge a pack? | Bossuyt 2021, Nutrients | Eye-tracking experiment | 398 adults; 20 products | Expert healthfulness ratings | Estimation accuracy | Nutri-Score helped, especially on hard-to-judge foods; the full panel could overload | Lab store, not a week of shopping | Supports comparison within a category |
| Can a good Nutri-Score hide processing? | Romero Ferreiro 2021, Nutrients | Cross-classification | Spanish market sample | NOVA plus Nutri-Score | Share of UPF per class | ~26% of A-class items were ultra-processed; UPF in every class | One country; older algorithm | A green letter is not a NOVA pass |
| How often do UPFs score A or B? | Open Food Facts 2020, cited by Nutri-Score team | Database cut | 220,522 NOVA 4 products | NOVA plus Nutri-Score | Class share | 8% A, 13% B, 79% C–E | Crowd-sourced labels; 2020 algorithm | Shows complementarity, not conflict |
| Is Nutri-Score fully validated for Europe? | van Tongeren and Jansen 2022, Foods | Validation-process review | Published Nutri-Score studies | Content, convergent, predictive tests | Validity claims | Ranking ability shown; EU guideline alignment and predictive validity still open | Review of a moving algorithm | Do not treat A–E as a disease forecast |
| What does Yuka add on top of Nutri-Score? | Yuka help, captured 13 Sep 2026 | First-party method note | Not a trial population | House rules | Score mix | 60% nutrition, 30% additives, 10% organic; high-risk additive caps at 49/100 | Not peer-reviewed as a clinical tool | Explains why two “healthy” yogurts can split |
What food scoring apps accuracy can hide
Portion. A grade per 100 g can flatter a food you eat by the bowl. Nut butters and cheeses often look “worse” per 100 g than a diet soda. The soda still leaves you without protein or fibre.
Processing. Nutri-Score reads the panel. NOVA reads industrial purpose and additives. Julia and colleagues have argued the two dimensions are complementary. A green letter on an ultra-processed drink is not a software bug. It is a different question.
Micronutrients beyond the formula. Iodine, B12, iron and unsaturated fat quality may not drive the class. Fortified products can look strong. Unfortified staples can look plain.
Additives as a moral colour. Yuka’s risk dots compress mixed evidence. Observational additive papers are not the same as an EFSA acceptable daily intake. A red dot can be a precaution. It is not a personal cancer risk.
Organic as a health bonus. A 10% organic lift rewards a label. It does not measure pesticide residues on that pack. It also does not make a sugary organic biscuit a weekly staple.
The rest of the week. A score cannot see leftovers, shared plates or the protein pattern in our everyday protein intake guide. One barcode is one item.
Barcode databases are not lab assays
Maringer and colleagues (Public Health Nutrition) scanned Dutch packs in several popular apps. MyFitnessPal identified 96% of products. Energy values sat within 5% of the label for 89% of those items. Sugar values sat within 5% for only 54%. Completeness is not accuracy. A green “verified” icon can mean the row is filled, not that it matches the pack in your hand.
User-edited rows add another drift. Yesterday’s reformulation may still sit beside last year’s numbers. Country labels differ. A UK pack and a US pack of the “same” brand are not one row.
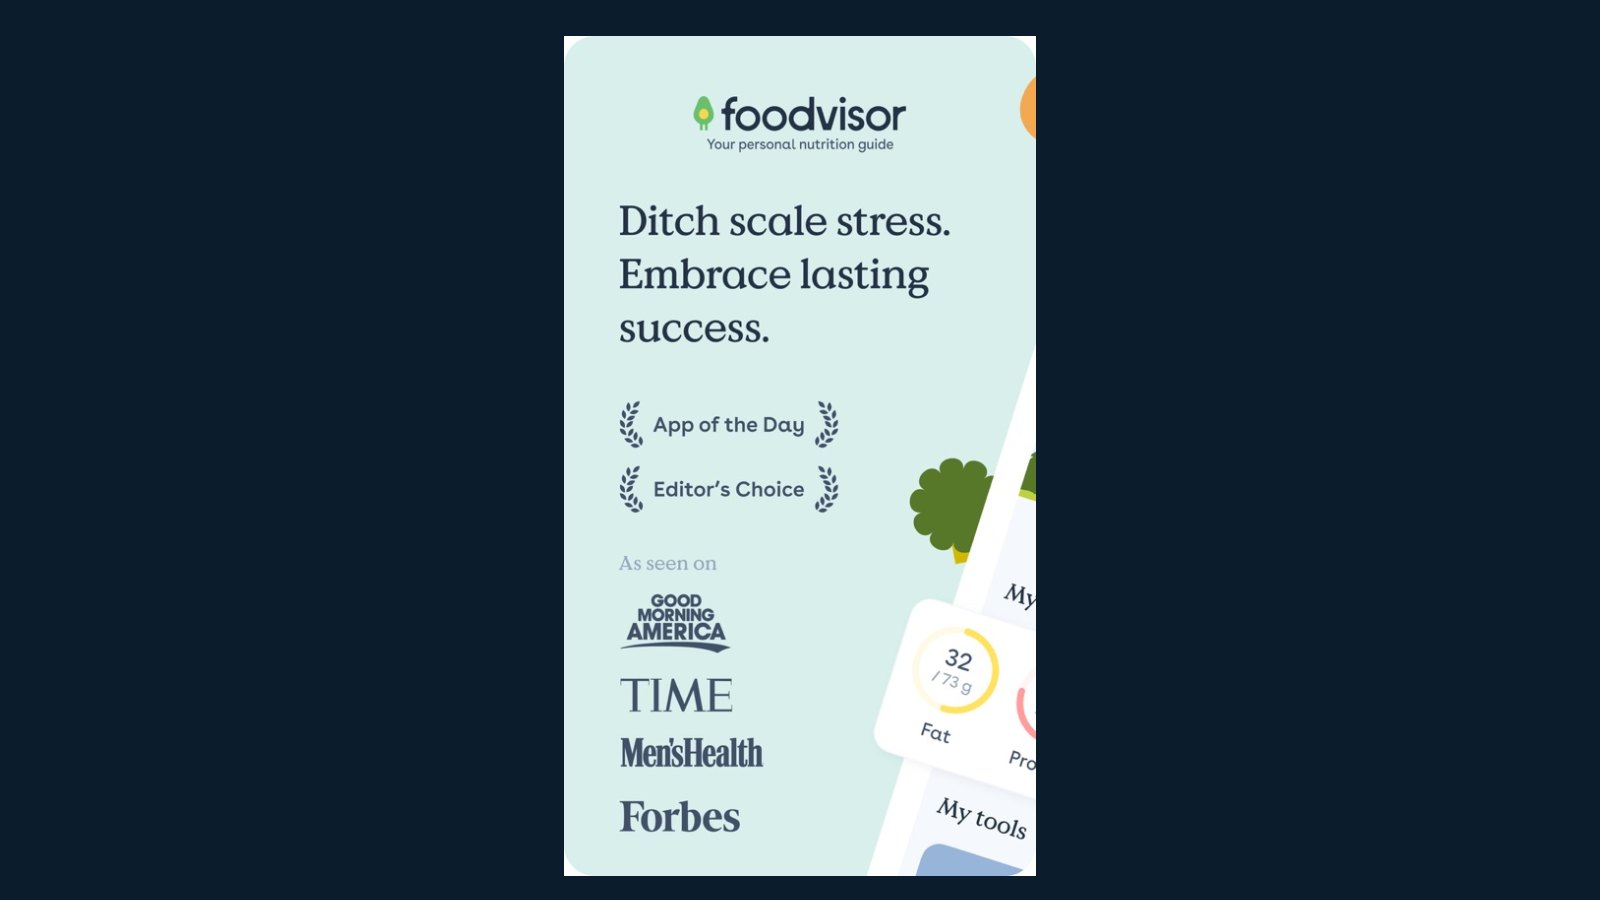
Photo calorie tools answer a different question. See Foodvisor and Cal AI for claimed camera features. A score app that never sees your plate cannot correct a cooked meal.
How to use a score without outsourcing the week
Compare two similar products. Two yogurts. Two breads. Two tomato sauces. That is the job nutrient profiling was built for.
Then read the short ingredient list and the serving size. If the mark is green and the first ingredients are sugar and starch, believe the list.
Use official plates for the week. NHS Eatwell still speaks in food groups. The US Dietary Guidelines speak in patterns. Neither issues a 0–100 app grade.
If a score makes you drop entire food groups, pause. Fortified cereals, medical nutrition and disability-friendly packs can be appropriate. Anxiety is a health signal, not a discipline win.
What remains unverified
We cannot verify 2026 Yuka or Ivy marks against a new clinical trial. We cannot say a 73/100 yogurt prevents disease. We cannot convert a red additive dot into a personal risk.
Food scoring apps accuracy is a measurement and design topic. Diet quality is a longer pattern of meals, sleep and health conditions. Keep those layers separate.
Frequently asked questions
Does a high food-score mean the product is healthy for me?
Why do two apps disagree on the same barcode?
Can an ultra-processed food get a good nutrition score?
Are additive risk colours the same as a regulator ban?
Should I avoid every product below 50/100?
Did Vitality Ledger rescore supermarket aisles?
Sources
- 1. How are food products rated?
- 2. Two dimensions of nutritional value: Nutri-Score and NOVA
- 3. The Nutri-Score algorithm: evaluation of its validation process
- 4. Nutri-Score and Nutrition Facts Panel through the eyes of the consumer
- 5. Food identification by barcode scanning in the Netherlands
- 6. The Eatwell Guide
Guidance changes. Figures were checked against the sources above at the time of review; always confirm current advice with your GP, pharmacist or clinician.
Image credits
- Photo: Photo by Shixart1985 on Wikimedia Commons / Openverse
- Photo: Photo by Jud McCranie on Wikimedia Commons / Openverse
- Photo: USDA photo via Wikimedia Commons / Openverse
- Photo: Photo by Pixabay on Pexels / Openverse
- Photo: Photo by Bdubay on Wikimedia Commons / Openverse
Was this useful?
Anyone can react — no account needed.

Discussion
0 comments · Name and email only · Email is never shown